
Contest statistics are important for several reasons most importantly in determining your return on investment.
We’ve packed Rewards Fuel contests with a lot of valuable stats. Let’s take a look at what comes with each contest.
Social Media Contest Statistics:
A basic breakdown of your contest, including engagement rate. Contest engagement rate is calculated by dividing the number of unique entries by the number of unique contest views.

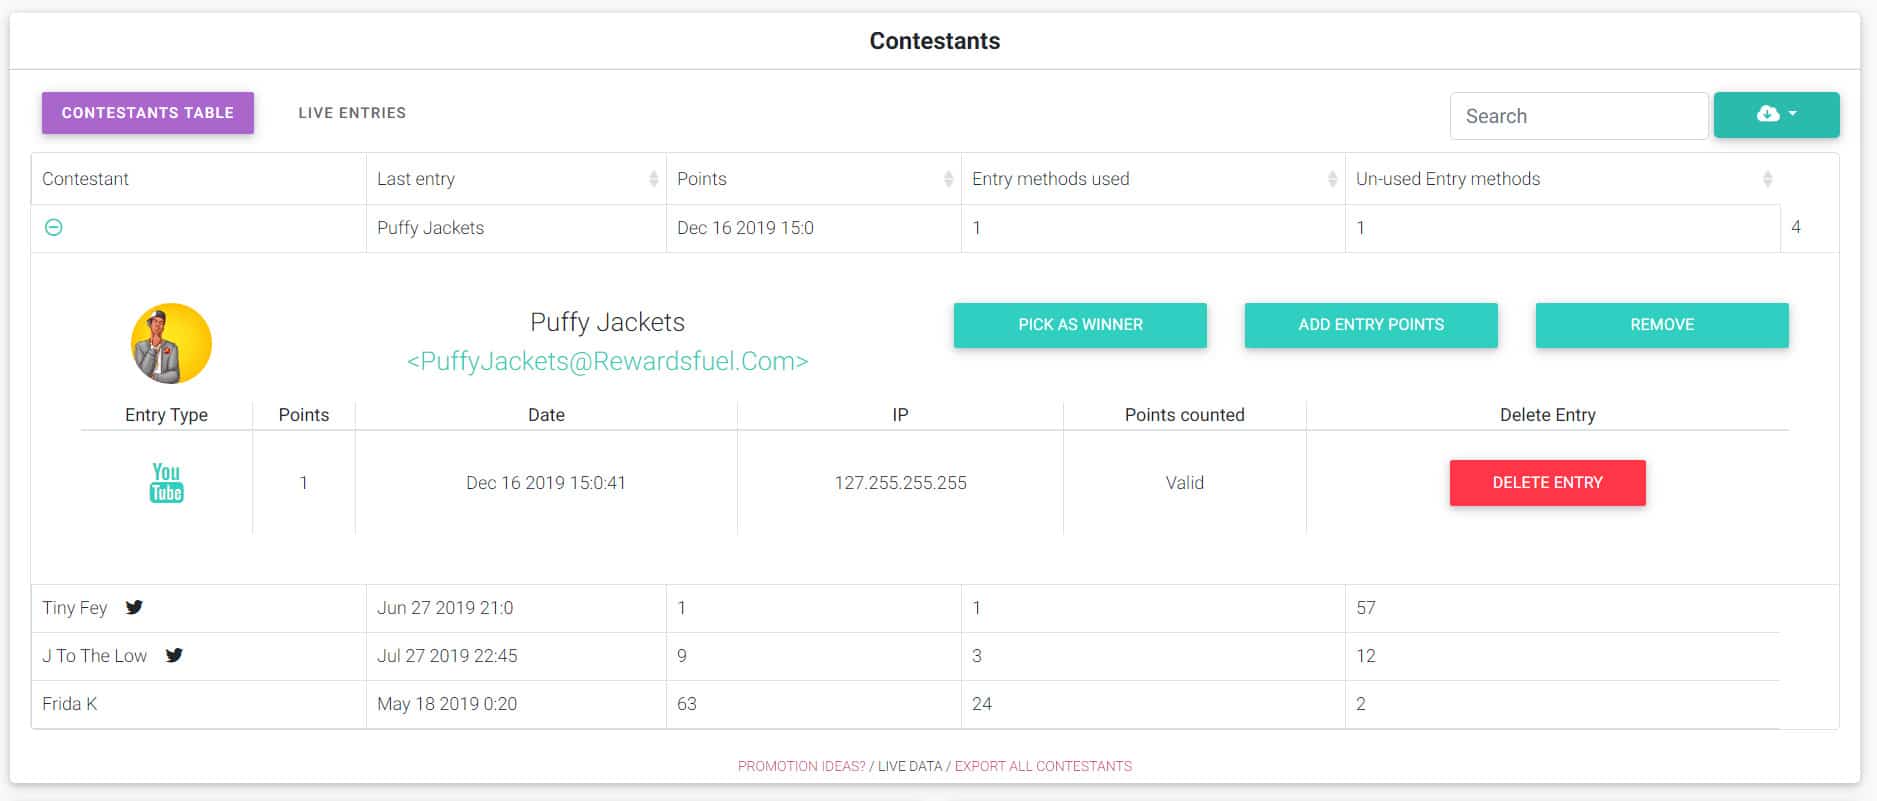
Contestants report:
See everyone who entered your contest, including which entry methods they used or decided to pass on.
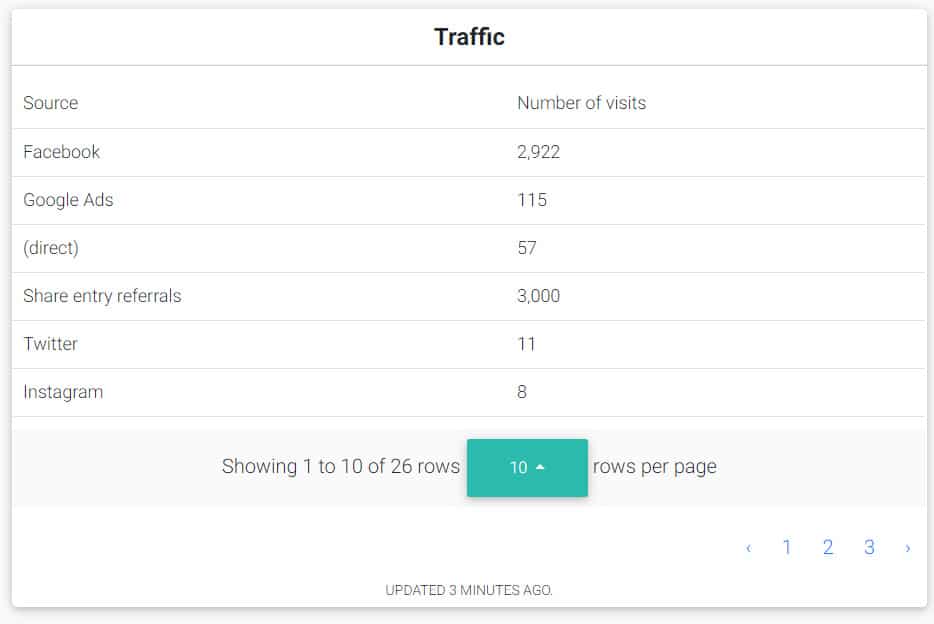
Contest stats – traffic summary:
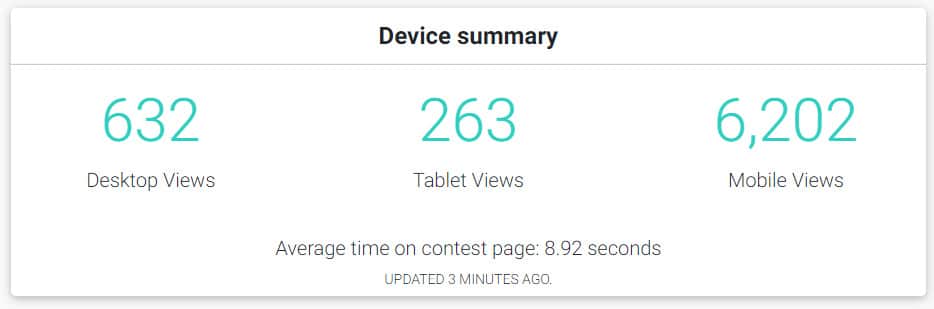
Contest statistics – devices:
See what devices people are using to access your contest.
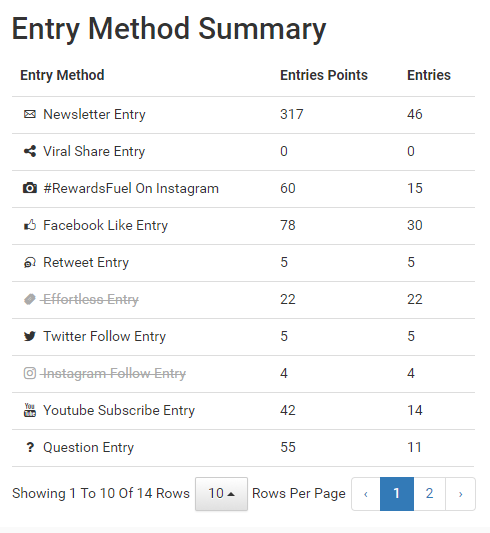
Entry Method Summary:
Discover which entry methods were used to enter your contest and how many points were accumulated.
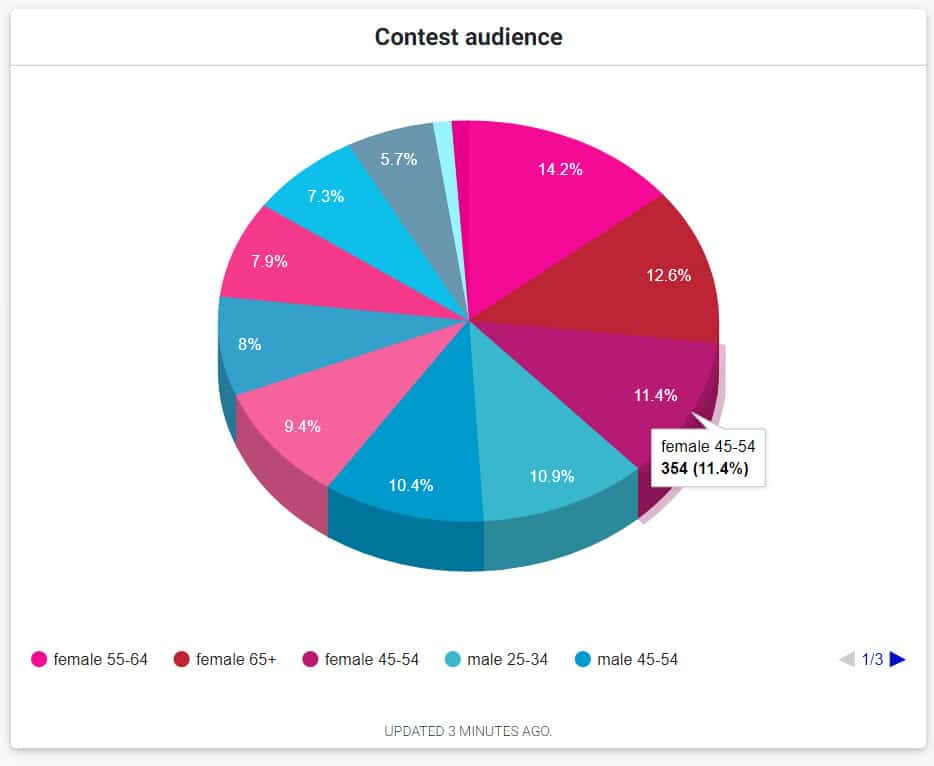
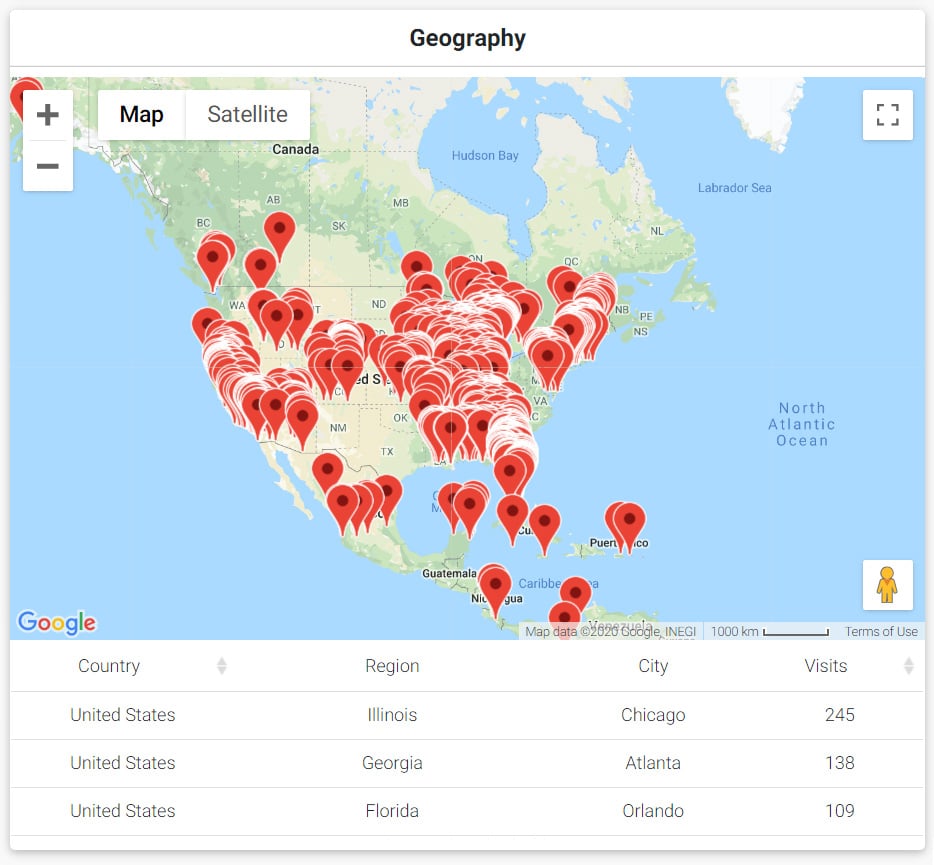
Geographic and Demographic Data:
Know who’s entering your contest and where they are located.
Use of your own Google Analytics account in addition to our statistics
To add this feature go to your contest settings page and click the “Add Google Analytics” link at the top.

Show the results of your work with our professional PDF statistics reports that you can print, email or take to any meeting.
Questions, comments or suggestions? Shoot us an email at info@rewardsfuel.com.
Contest TIPS:
- Combine Entry Methods: You have 30 different entry methods to choose from including ‘Subscribe on YouTube‘ if your main priority is to grow your channel.
- Collaborate: Make that prize bigger and better! Plus benefit from the extra exposure you’ll receive through your partners. Check out this great case study to get inspired.
- Video marketing: Our #hashtag contests for Instagram will create user-generated video and photo content for your website.
- Promote it: 22 contest websites who will promote your contest.
- Viral Share Entry: Be sure to add this powerful entry method into your contest.
No Comments yet!